Chromatic Aberration
For more information on this page, see:
There are up to a hundred user selectable wavelengths between 190 nm and 800 nm to use for collecting data on the Optima AUC during a single experiment.
Using the calibration disk, described here, the chromatic aberration effects are shown since scanning the disk at different wavelengths produce different radial positions for the same physical location. Total radial deviations ranged between 40 \(\mu\)m- 380 \(\mu\)m. At the greatest deviation, 380 \(\mu\)m, the error contributed to as much as 0.66% in the measure of the sedimentation coefficient. The largest errors occur near the top of the cell, decreasing towards the bottom. This means several things: first, the absolute measurement is incorrect, and; secondly, the radial deviation contributes to an apparently non-constant \(s\) value.
Causes
While the exact cause is not precisely known, these deviations are likely a result of imperfections in the AUC's optical system, specifically the non-vertical light beam tracing. The lack of perpendicular incident light is supported by the appearance of shadows on one side of the calibration disk's edges. As shown below in \(\textbf{Figure 1}\), the shadow produces a zig-zag effect on the deviations from the predicted positions.
There is additionally a wavelength-dependent variability in the radial scaling between the top and bottom of the cell. There is a change in the absolute deviation when the inner edge deviations are compared with the outer edge deviations, with the lower wavelength producing a higher magnitude of total offset.
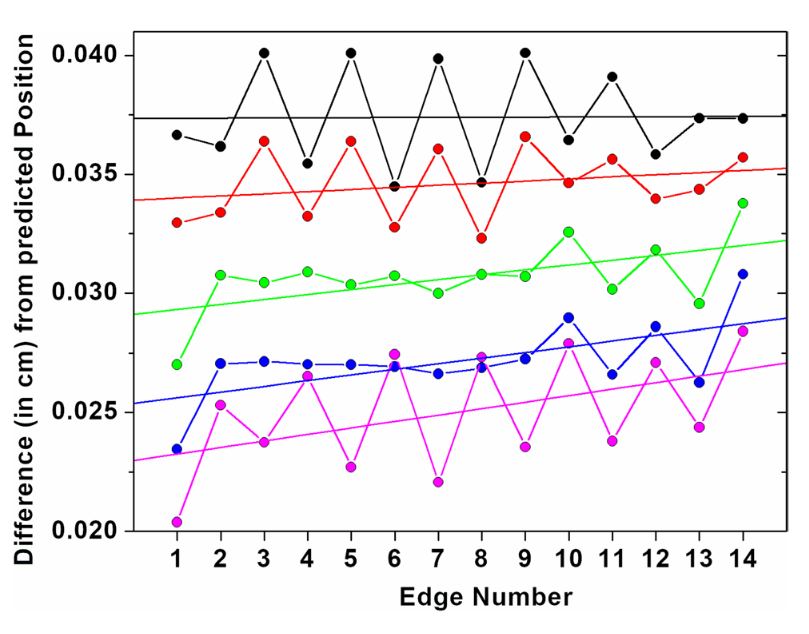
\(\textbf{Figure 1}\) Edge position deviations from predicted positions for observations made at: 200 nm (black), 230 nm (red), 300 nm (green), 460 nm (blue), and 750 nm (magenta).
\(\textbf{Table 1}\) Edge positions in cm at rest versus predicted, measured at 250 nm.
Correction Methods
A calibration curve based on the shift in edge position as a function of wavelength can be constructed to correct for the wavelength-dependent variations.
Another correction method involves measuring the position of a meniscus over the wavelength range. In this method, the meniscus positions of 4-8 samples filled with 0.23 ml of water can be repeatedly scanned in intensity mode at 62 wavelengths, spanning 190 nm to 800 nm in 10 nm intervals. The optimal rotor speed is 14,000 rpm, since at that speed, the scanning time is minimized due to the synchronization with the flash rate of the flash lamp.
The following is the recommended procedure for how to build a calibration file from using the meniscus position method. A pdf version of this protocol is available here.
-
Import the Calibration Data into UltraScan's Utilities: View Raw Optima Data module.
-
Zoom on the meniscus region for each channel while in intensity mode. For each channel, a csv file will be generated into the UltraScan imports data folder. This dataset maps the radial position of the meniscus minima against wavelength.
-
Use a third party spreadsheet program to average the meniscus positions. Subtract the 250 nm value from each wavelengths radial position. The 250 nm position is assumed to be correct if the instrument has been radially calibrated with the manufacturer's counterbalance at that wavelength. Assume this position to be the true offset with zero correction.
-
Fit the averaged data with a parameterizing curve (with 1 nm increments).
-
Upload the chromatic aberration profile into the Edit: Preferences: Instrument Preferences instrument configuration.
Chromatic Aberration Profile Example
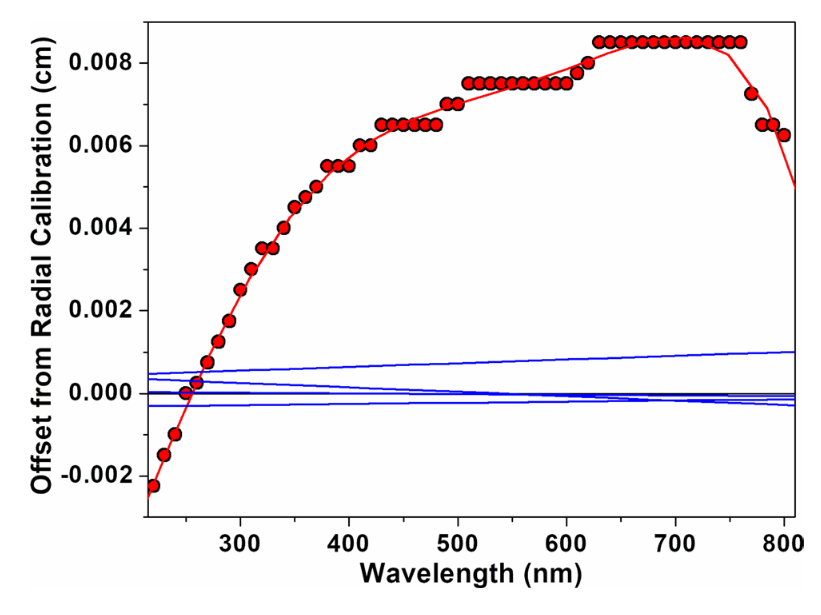 \(\textbf{Figure 2}\) Example of the chromatic aberration error in the Optima AUC.
RED: deviation from the radial calibration at 250 nm for four averaged meniscus positions. Data is fitted to a 5-th order polynomial.
BLUE: observed meniscus positions for the four input menisci after correction. All four positions now show < 0.001 cm error.
M.S. 21.07.22
Note: update protocol.